Usage tab
Usage shows how much you're spending and when you'll run out of quota. It has
three views: Overview (/usage), Quota (/usage/quota) and Costs
(/usage/costs).
When the tab shows
The tab stays hidden until there is something to show. Quota needs subscription quota samples or OpenCode activity. Costs needs real pay-per-token spend, or Show cost on subscription in Config › Usage & costs. Once either has data, all three views are offered, and an empty one says so.
On a subscription, Costs stays empty of estimates until you turn that setting on. Collapse empty Usage views in Config › Appearance drops the switcher when only one view has data.
Agents and operators can also query quotas and costs through the daemon with
tclaude usage and tclaude costs, including JSON output.
Overview
The glance page: headline cards for spend in the Costs view's current span (with the month projection), spend today, the next predicted quota wall, and how many quota windows are predicted to run out before they reset; a compact card per quota window (current percentage, reset countdown, sparkline with its forecast, prediction status); and the span's spend chart beside the top agents. Every card links into the full Quota or Costs view. The spend figures follow the span and provider/model filters chosen on the Costs view.
A Limits block shows a bar for each limit you've set, with limits & budgets › to manage them or Set a limit… to add one. See Usage and costs.
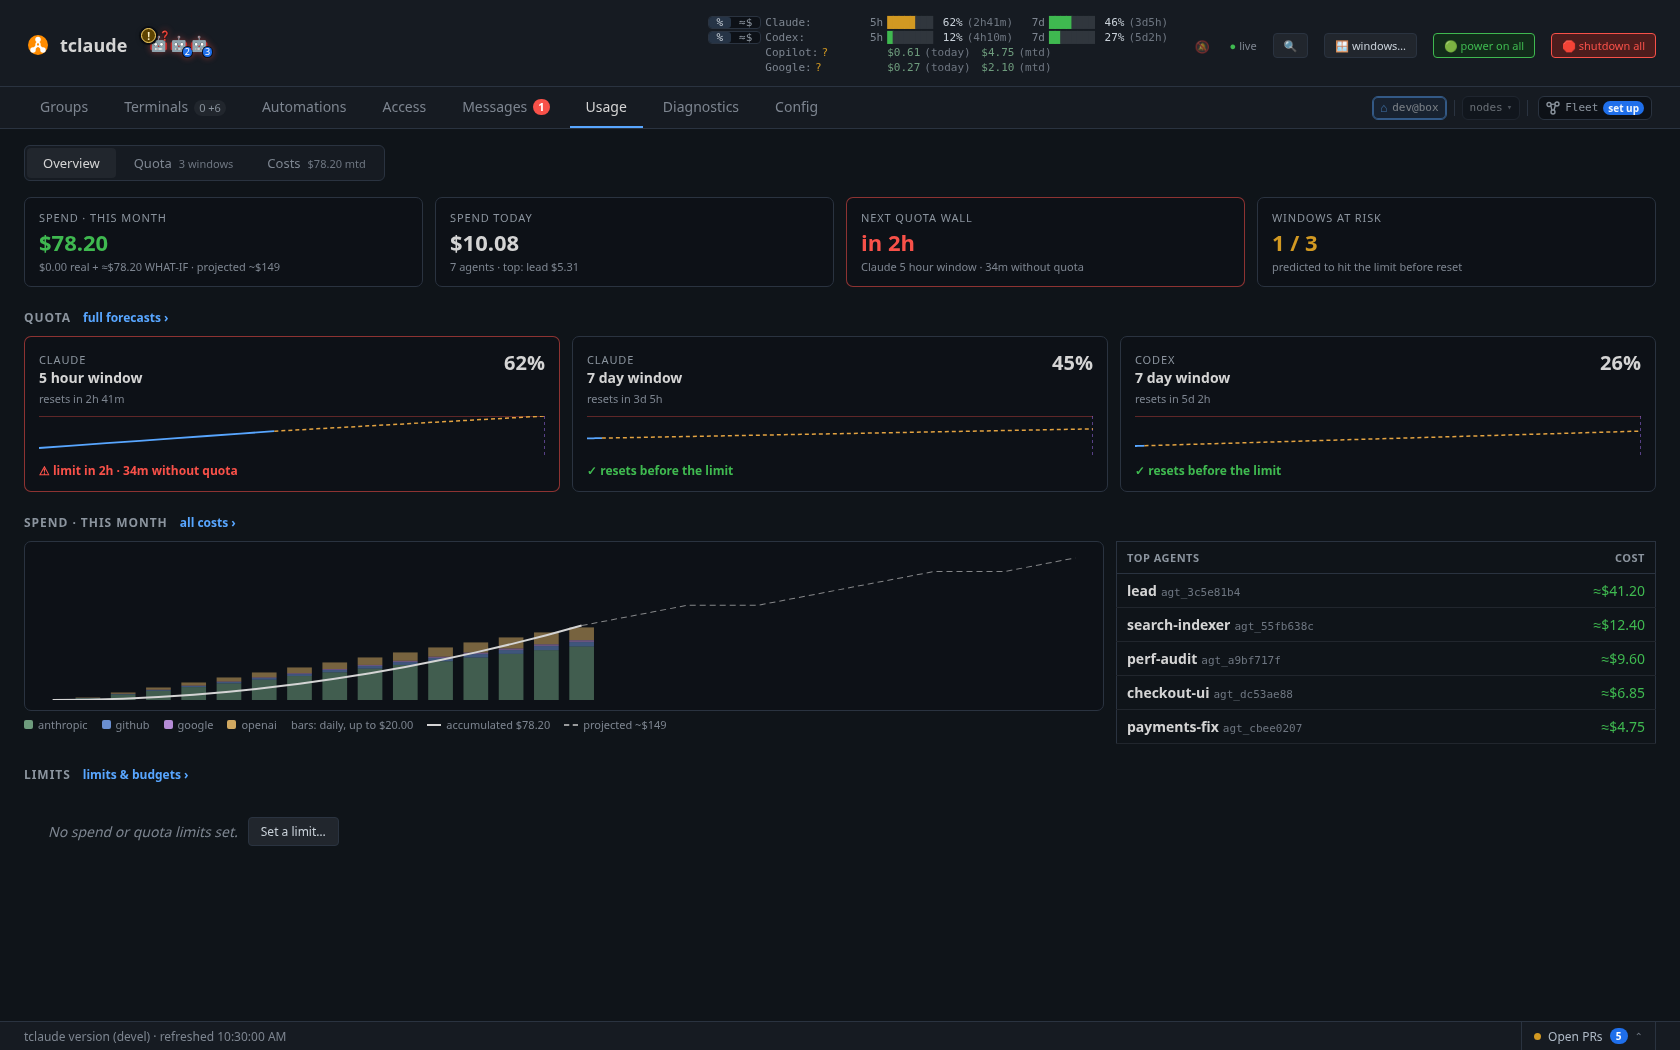
The Usage overview: spend and quota headline cards, a compact card per quota window, and the month's spend beside the top agents
Quota
Subscription quota and forecasting: one card per provider × quota window (Claude "5 hour window", "7 day window" and "7 day Sonnet window"; Codex "5 hour window" and "7 day window"; GitHub Copilot "Monthly premium requests"). Each card shows the current percentage, sample age, and reset countdown over an SVG chart with the observed line, a dashed forecast line, reset markers, a now marker, and excluded points. Sampling runs every 15 minutes with 90-day retention; history spans 24h to 90d and look-ahead 5h to 30d, persisted per series. Copilot cards can switch the headline, chart, tooltips, and forecast pace between percentage and native AIC credits; the choice is remembered per series.
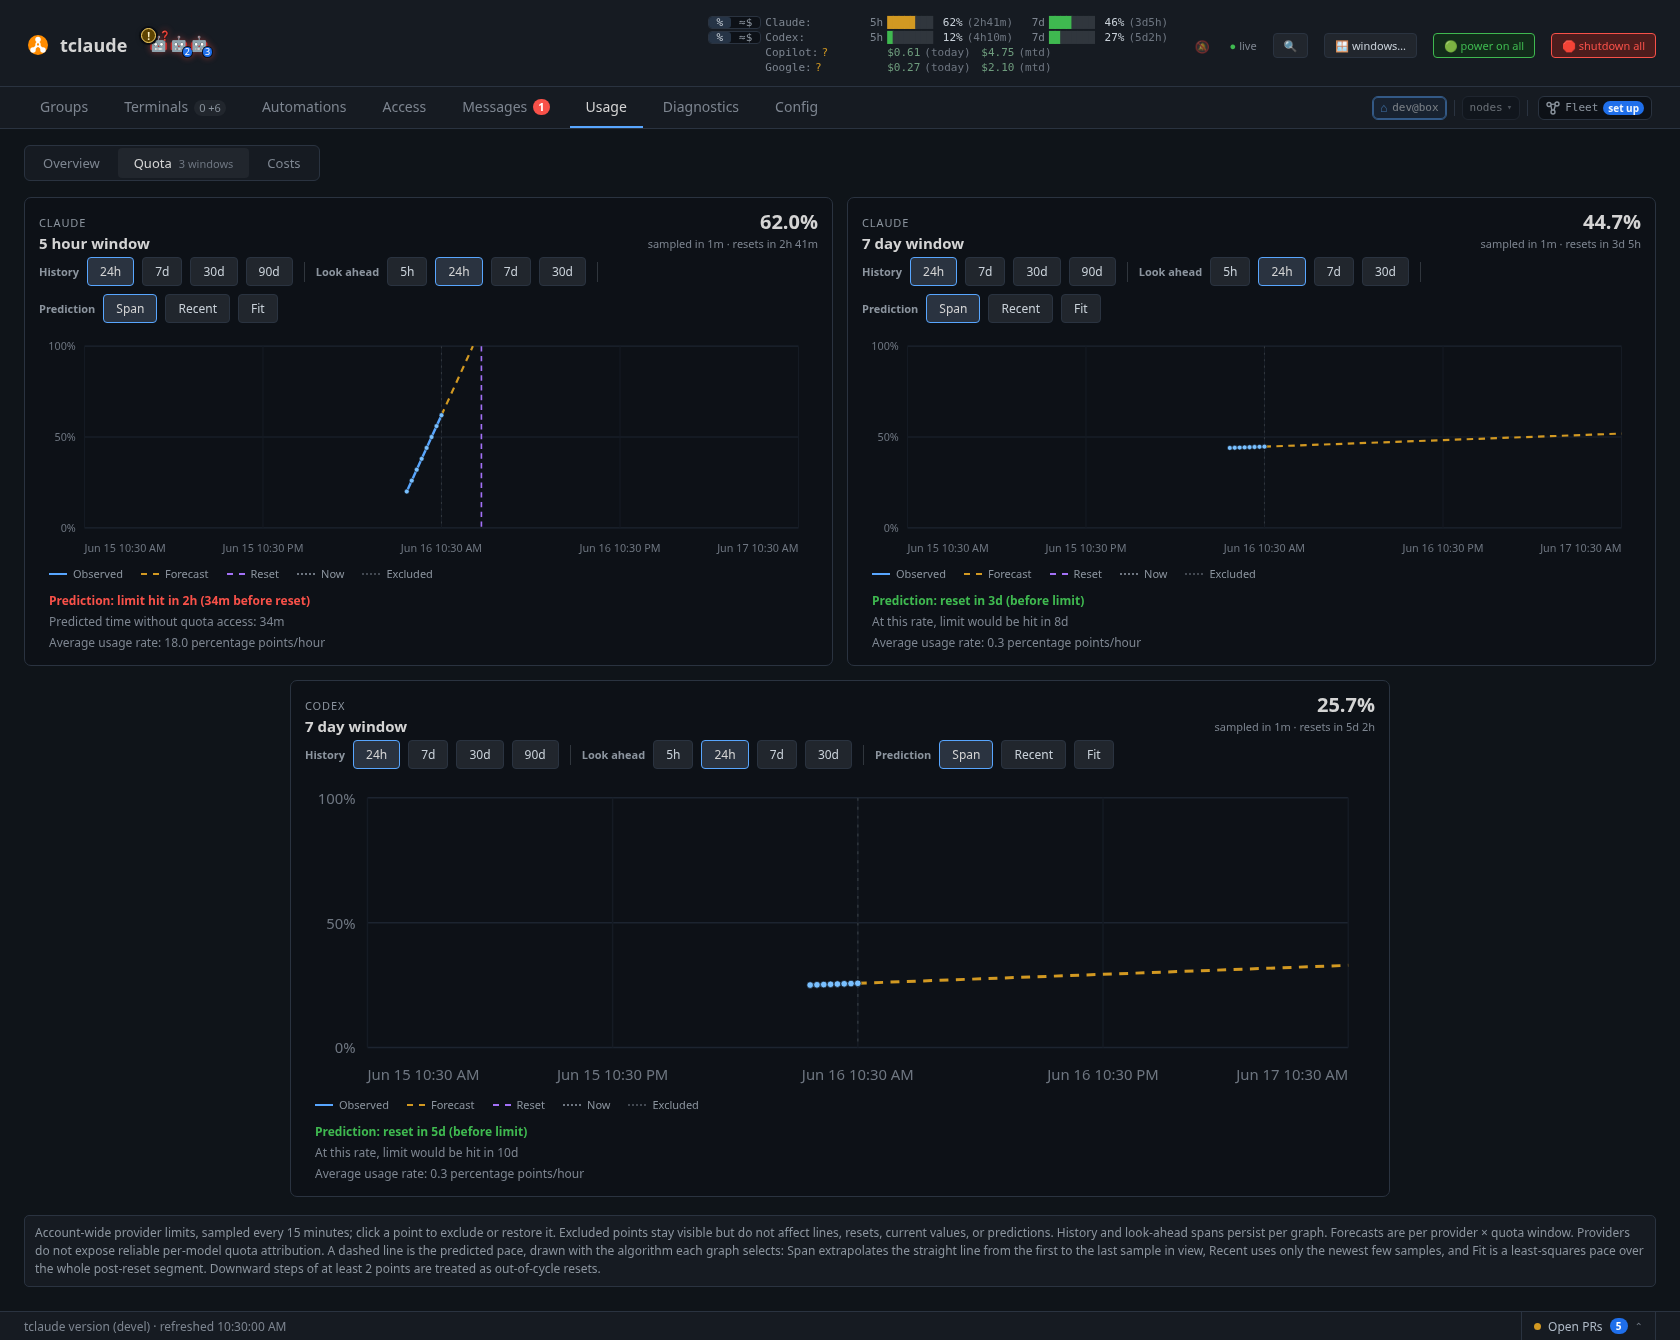
Per-provider quota windows with least-squares forecasts — here predicting the Claude five-hour window goes dark 34m before reset
The forecast detects resets (a declared boundary, or a downward step of at least 2 points), then estimates a pace on the post-reset segment, yielding %/hour and an ETA to 100%. Each card picks which estimator draws its dashed line with its own Prediction control, next to the span controls, and the choice persists per series:
- Span (default) extends the straight line through the first and last sample inside that card's history range. Narrowing the range to 24h is how you ask for a more recent pace.
- Recent uses only the newest few samples, so a burst that started minutes ago is not averaged against the idle hours before it; it reaches further back only when those samples are bunched too close together to divide by.
- Fit is a least-squares slope on the post-reset baseline — a running max, so brief dips don't lower the pace. It is the smoothest and the slowest to react: a long idle stretch holds it down well after usage starts climbing.
All three are computed server-side for every card and ride on the same response, so switching is instant; all are anchored at the latest sample and clipped to the current segment, so no line is drawn across a reset. A forecast needs at least 3 samples over 30 minutes in its own window before it commits ("Prediction warming up"), and reports statuses such as "limit hit Xh before reset" with the predicted no-quota window. Click any point to exclude it from all the math (and click again to restore) — useful when a one-off spike would poison the forecast. There is no per-model quota breakdown; providers do not expose reliable attribution. OpenCode activity raises a coverage-lag warning banner.
Costs
Spend over time: an accumulated-cost line graph, a stacked daily bar chart
(by provider by default; the Breakdown menu also stacks by model, both, or
neither), a per-model rollup strip, and a sortable per-agent table with
totals and cross-day agent chains. Provider and model selectors narrow every
figure in the tab, including both graphs and the projection. The selectors are
linked dropdowns with cost-share and agent-count context: turning off a
provider also turns off models recorded only through that provider, while a
model shared by another selected provider stays available; turning the provider
back on selects its models again. The accumulated
and daily graphs use the same date domain and plot width. Hover either the
solid recorded line or the dashed month-projection line for the day's change
and accumulated value. Spans are: This month (the only span with a projection),
Last 7d, Last 30d, Last 90d, and a month browser going 24 months back. The span is in the
address (/usage/costs?period=30d, ?period=2026-08 for a past month), so
each pick is a history step and a link opens that span. Model attribution uses
the last model recorded for each agent-day slice; a model switch within the
same session and calendar day is therefore grouped under the final observed
model.
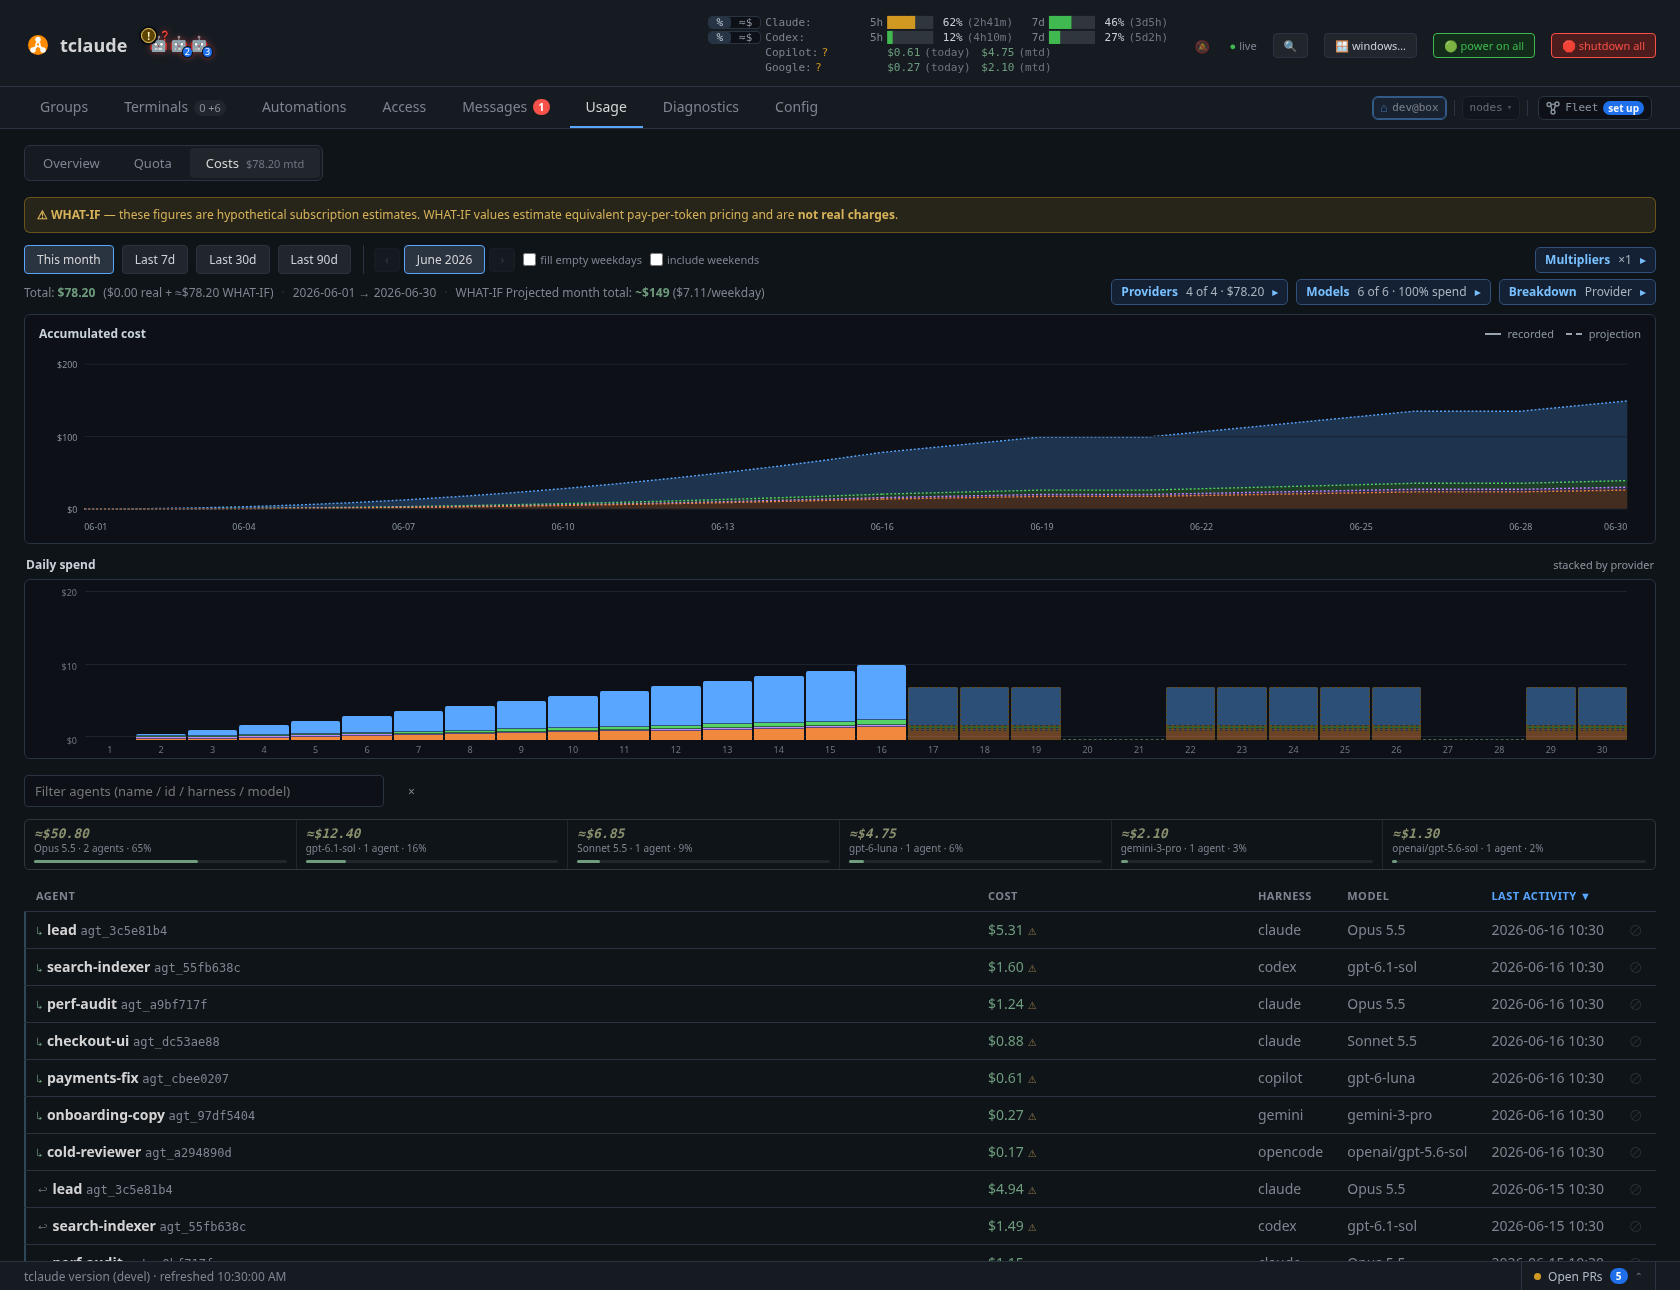
The Costs tab: month bars, per-model breakdown cards, and the per-agent table
Real API spend and subscription what-if estimates are kept visually
distinct throughout: totals split into $real + ≈$whatif, a banner appears
whenever estimates are mixed in, and estimated rows carry ⚠︎ with a hover
breakdown (Copilot credits show as "N credits — $X subscription value").
The month projection extrapolates spend over elapsed weekdays, with toggles
for filling empty weekdays and including weekends. The Multipliers menu sets a display-only default and overrides for Claude Code,
Codex, OpenCode, Copilot, Gemini CLI, and pi. Overrides replace the default: leave a harness blank
(or choose Use default) to inherit it; explicitly enter 1 to disable
adjustment for that harness. OpenCode uses one multiplier across all its providers.
Reset all to ×1 removes all adjustments. Changes save automatically and apply
to dashboard dollar amounts, including agent badges, charts, projections, and
top-bar totals. Recorded costs and native credits remain unchanged. The same
settings are under Config › Usage & costs.
To leave an agent out of the books — for example spend that was counted twice
before clones and imports stopped copying their source's cost — click the dim
⊘ at the end of its row. That ignores the whole conversation (all of its days)
in every cost total: this view, the header and Overview figures, spend alerts
and tclaude costs. Ignored agents are listed in the collapsible Ignored
section under the table, with the spend restoring them would add back to the
current span; Restore counts them again. The recorded cost history is
never modified. Restricted peer views show these buttons greyed out.